Earthquakes
USGS
| MAG | UTC DATE-TIME y/m/d h:m:s |
LAT deg |
LON deg |
DEPTH km |
Region | |
|---|---|---|---|---|---|---|
| MAP | 2.5 | 2012/09/08 23:27:54 | 61.523 | -146.435 | 15.0 | SOUTHERN ALASKA |
| MAP | 3.4 | 2012/09/08 22:44:23 | 19.242 | -64.633 | 15.0 | VIRGIN ISLANDS REGION |
| MAP | 4.4 | 2012/09/08 21:11:41 | 11.938 | 43.461 | 10.0 | NEAR THE COAST OF DJIBOUTI |
| MAP | 3.3 | 2012/09/08 21:03:55 | 19.618 | -64.170 | 60.0 | VIRGIN ISLANDS REGION |
| MAP | 4.8 | 2012/09/08 20:55:50 | 23.602 | 126.748 | 10.0 | SOUTHEAST OF THE RYUKYU ISLANDS |
| MAP | 5.6 | 2012/09/08 20:29:32 | 10.095 | -85.321 | 35.6 | COSTA RICA |
| MAP | 4.3 | 2012/09/08 19:19:50 | 53.110 | 156.548 | 270.7 | KAMCHATKA PENINSULA, RUSSIA |
| MAP | 2.6 | 2012/09/08 18:47:16 | 60.244 | -152.426 | 89.1 | SOUTHERN ALASKA |
| MAP | 4.8 | 2012/09/08 18:27:13 | -6.598 | 106.696 | 8.8 | JAVA, INDONESIA |
| MAP | 4.9 | 2012/09/08 17:45:38 | -6.716 | 146.149 | 139.9 | EASTERN NEW GUINEA REG, PAPUA NEW GUINEA |
| MAP | 4.7 | 2012/09/08 16:31:24 | -3.364 | 135.482 | 34.3 | PAPUA, INDONESIA |
| MAP | 5.1 | 2012/09/08 16:27:39 | 2.405 | 126.732 | 35.0 | MOLUCCA SEA |
| MAP | 3.0 | 2012/09/08 14:10:41 | 19.610 | -64.394 | 39.0 | VIRGIN ISLANDS REGION |
| MAP | 3.1 | 2012/09/08 13:03:12 | 19.612 | -64.408 | 43.0 | VIRGIN ISLANDS REGION |
| MAP | 4.7 | 2012/09/08 12:35:40 | 1.140 | 120.665 | 35.7 | MINAHASA, SULAWESI, INDONESIA |
| MAP | 2.9 | 2012/09/08 12:27:09 | 18.864 | -67.584 | 5.0 | PUERTO RICO REGION |
| MAP | 4.3 | 2012/09/08 12:01:10 | 10.039 | -85.435 | 43.1 | COSTA RICA |
| MAP | 2.8 | 2012/09/08 11:11:34 | 51.669 | -168.128 | 34.1 | FOX ISLANDS, ALEUTIAN ISLANDS, ALASKA |
| MAP | 2.8 | 2012/09/08 10:54:17 | 32.461 | -115.602 | 12.8 | BAJA CALIFORNIA, MEXICO |
| MAP | 6.1 | 2012/09/08 10:51:43 | -3.189 | 135.084 | 14.1 | PAPUA, INDONESIA |
| MAP | 4.1 | 2012/09/08 10:01:07 | 37.329 | 37.085 | 3.5 | CENTRAL TURKEY |
| MAP | 4.5 | 2012/09/08 09:50:22 | 10.361 | -85.654 | 35.8 | COSTA RICA |
| MAP | 4.6 | 2012/09/08 09:22:20 | -10.903 | 113.843 | 25.1 | SOUTH OF JAVA, INDONESIA |
| MAP | 2.7 | 2012/09/08 08:39:23 | 36.294 | -120.311 | 7.1 | CENTRAL CALIFORNIA |
| MAP | 4.6 | 2012/09/08 07:36:36 | -10.790 | 113.964 | 9.8 | SOUTH OF JAVA, INDONESIA |
| MAP | 4.3 | 2012/09/08 07:35:39 | 53.798 | -164.969 | 52.5 | UNIMAK ISLAND REGION, ALASKA |
| MAP | 4.7 | 2012/09/08 07:18:18 | 6.648 | 95.614 | 250.3 | NICOBAR ISLANDS, INDIA REGION |
| MAP | 3.3 | 2012/09/08 07:14:50 | 19.621 | -64.364 | 11.0 | VIRGIN ISLANDS REGION |
| MAP | 5.7 | 2012/09/08 06:54:19 | 21.517 | 145.921 | 9.2 | MARIANA ISLANDS REGION |
| MAP | 3.0 | 2012/09/08 05:21:05 | 58.834 | -153.269 | 120.3 | KODIAK ISLAND REGION, ALASKA |
| MAP | 4.6 | 2012/09/08 05:09:56 | -7.051 | -12.394 | 10.0 | ASCENSION ISLAND REGION |
| MAP | 3.5 | 2012/09/08 04:57:45 | 45.122 | -122.692 | 22.6 | OREGON |
| MAP | 3.6 | 2012/09/08 04:54:30 | 19.510 | -64.256 | 66.0 | VIRGIN ISLANDS REGION |
| MAP | 2.7 | 2012/09/08 04:43:21 | 58.937 | -152.731 | 53.2 | KODIAK ISLAND REGION, ALASKA |
| MAP | 5.2 | 2012/09/08 04:11:49 | -9.820 | 160.367 | 48.7 | SOLOMON ISLANDS |
| MAP | 4.2 | 2012/09/08 03:17:37 | 38.527 | 55.691 | 12.5 | TURKMENISTAN |
| MAP | 4.2 | 2012/09/08 02:27:22 | 12.090 | -88.533 | 35.1 | OFF THE COAST OF EL SALVADOR |
| MAP | 4.6 | 2012/09/08 01:41:26 | 33.754 | 132.183 | 55.7 | SHIKOKU, JAPAN |
| MAP | 6.0 | 2012/09/09 05:39:21 | 49.473 | 155.517 | 56.8 | KURIL ISLANDS |
| MAP | 2.5 | 2012/09/09 05:33:23 | 60.625 | -147.676 | 13.9 | SOUTHERN ALASKA |
| MAP | 4.7 | 2012/09/09 05:14:53 | 16.230 | -98.198 | 11.9 | OAXACA, MEXICO |
| MAP | 4.4 | 2012/09/09 03:30:27 | -10.749 | 114.053 | 22.2 | SOUTH OF BALI, INDONESIA |
| MAP | 3.0 | 2012/09/09 02:09:00 | 18.629 | -66.737 | 27.0 | PUERTO RICO REGION |
| MAP | 3.4 | 2012/09/09 01:58:53 | 35.379 | -96.543 | 4.9 | OKLAHOMA |
| MAP | 4.9 | 2012/09/09 00:13:50 | -28.087 | -176.526 | 9.9 | KERMADEC ISLANDS REGION |
………………………
Strong 6.0 quake hits Indonesia
- From: AP
A MODERATELY strong earthquake has hit eastern Indonesia, causing panic among residents, but there were no immediate reports of damage or injuries. No tsunami warning was issued.
The U.S. Geological Survey says the 6.0-magnitude quake struck off the eastern province of Papua. It says it was fairly shallow, just 20 kilometers beneath the sea, which often causes more shaking than deeper quakes.
Witnesses said shocked residents and hotel guests in Nabire town ran outside screaming.
Indonesia has frequent earthquakes because of its location on the Pacific “Ring of Fire,” an arc of volcanoes and fault lines encircling the Pacific Basin.
Video: Moment of deadly China earthquake, landslide caught on
Published on Sep 7, 2012 by RussiaToday
A series of earthquakes hit rural southwestern China on Friday, collapsing homes and triggering landslides. At least 50 people were killed, and the death toll is expected to rise.
| 08.09.2012 | Earthquake | China | Province of Sichuan, [About 51 km NE Zhaotong (affected also Yunnan and Guizhou provinces)] |  |
 |
Earthquake in China on Friday, 07 September, 2012 at 08:32 (08:32 AM) UTC.
| Description | |
| A shallow earthquake hit southwestern China on Friday, killing at least 24 people, state media said. 150 people were also hurt in the quake that hit Yunnan and Guizhou provinces. An official from the Yunnan provincial government earthquake office, who like many Chinese bureaucrats would not give his name, earlier said 20 people had died. The quake destroyed or damaged 20,000 homes. Buildings in rural areas in China are often constructed poorly. In 2008, a severe earthquake in Sichuan province, just north of Yunnan, killed nearly 90,000 people, with many of the deaths blamed on poorly built buildings, including schools. The U.S. Geological Survey said the magnitude 5.6 quake hit at a depth of 9.8 kilometers (6.1 miles). Shallower earthquakes often cause more damage than deeper ones. |
…………………………………
LISS – Live Internet Seismic Server
GSN Stations
These data update automatically every 30 minutes. Last update: September 9, 2012 05:19:07 UTC
Seismograms may take several moments to load. Click on a plot to see larger image.
CU/ANWB, Willy Bob, Antigua and Barbuda

CU/BBGH, Gun Hill, Barbados

CU/BCIP, Isla Barro Colorado, Panama

CU/GRGR, Grenville, Grenada

CU/GRTK, Grand Turk, Turks and Caicos Islands

CU/GTBY, Guantanamo Bay, Cuba

CU/MTDJ, Mount Denham, Jamaica

CU/SDDR, Presa de Sabaneta, Dominican Republic

CU/TGUH, Tegucigalpa, Honduras

IC/BJT, Baijiatuan, Beijing, China

IC/ENH, Enshi, China

IC/HIA, Hailar, Neimenggu Province, China

IC/LSA, Lhasa, China

IC/MDJ, Mudanjiang, China

IC/QIZ, Qiongzhong, Guangduong Province, China

IU/ADK, Aleutian Islands, Alaska, USA

IU/AFI, Afiamalu, Samoa

IU/ANMO, Albuquerque, New Mexico, USA

IU/ANTO, Ankara, Turkey

IU/BBSR, Bermuda

IU/BILL, Bilibino, Russia

IU/CASY, Casey, Antarctica

IU/CCM, Cathedral Cave, Missouri, USA

IU/CHTO, Chiang Mai, Thailand

IU/COLA, College Outpost, Alaska, USA

IU/COR, Corvallis, Oregon, USA

IU/CTAO, Charters Towers, Australia

IU/DAV,Davao, Philippines

IU/DWPF,Disney Wilderness Preserve, Florida, USA

IU/FUNA,Funafuti, Tuvalu

IU/FURI, Mt. Furi, Ethiopia

IU/GNI, Garni, Armenia

IU/GRFO, Grafenberg, Germany

IU/GUMO, Guam, Mariana Islands

IU/HKT, Hockley, Texas, USA

IU/HNR, Honiara, Solomon Islands

IU/HRV, Adam Dziewonski Observatory (Oak Ridge), Massachusetts, USA

IU/INCN, Inchon, Republic of Korea

IU/JOHN, Johnston Island, Pacific Ocean

IU/KBS, Ny-Alesund, Spitzbergen, Norway

IU/KEV, Kevo, Finland

IU/KIEV, Kiev, Ukraine

IU/KIP, Kipapa, Hawaii, USA

IU/KMBO, Kilima Mbogo, Kenya

IU/KNTN, Kanton Island, Kiribati

IU/KONO, Kongsberg, Norway

IU/KOWA, Kowa, Mali

IU/LCO, Las Campanas Astronomical Observatory, Chile

IU/LSZ, Lusaka, Zambia

IU/LVC, Limon Verde, Chile

IU/MA2, Magadan, Russia

IU/MAJO, Matsushiro, Japan

IU/MAKZ,Makanchi, Kazakhstan

IU/MBWA, Marble Bar, Western Australia

IU/MIDW, Midway Island, Pacific Ocean, USA

IU/MSKU, Masuku, Gabon

IU/NWAO, Narrogin, Australia

IU/OTAV, Otavalo, Equador

IU/PAB, San Pablo, Spain

IU/PAYG Puerto Ayora, Galapagos Islands

IU/PET, Petropavlovsk, Russia

IU/PMG, Port Moresby, Papua New Guinea

IU/PMSA, Palmer Station, Antarctica

IU/POHA, Pohakaloa, Hawaii

IU/PTCN, Pitcairn Island, South Pacific

IU/PTGA, Pitinga, Brazil

IU/QSPA, South Pole, Antarctica

IU/RAO, Raoul, Kermandec Islands

IU/RAR, Rarotonga, Cook Islands

IU/RCBR, Riachuelo, Brazil

IU/RSSD, Black Hills, South Dakota, USA

IU/SAML, Samuel, Brazil

IU/SBA, Scott Base, Antarctica

IU/SDV, Santo Domingo, Venezuela

IU/SFJD, Sondre Stromfjord, Greenland

IU/SJG, San Juan, Puerto Rico

IU/SLBS, Sierra la Laguna Baja California Sur, Mexico

IU/SNZO, South Karori, New Zealand

IU/SSPA, Standing Stone, Pennsylvania USA

IU/TARA, Tarawa Island, Republic of Kiribati

IU/TATO, Taipei, Taiwan

IU/TEIG, Tepich, Yucatan, Mexico

IU/TIXI, Tiksi, Russia

IU/TRIS, Tristan da Cunha, Atlantic Ocean

IU/TRQA, Tornquist, Argentina

IU/TSUM, Tsumeb, Namibia

IU/TUC, Tucson, Arizona

IU/ULN, Ulaanbaatar, Mongolia

IU/WAKE, Wake Island, Pacific Ocean

IU/WCI, Wyandotte Cave, Indiana, USA

IU/WVT, Waverly, Tennessee, USA

IU/XMAS, Kiritimati Island, Republic of Kiribati

IU/YAK, Yakutsk, Russia

IU/YSS, Yuzhno Sakhalinsk, Russia

**********************************************************************************************************
Volcanic Activity
Nicaraguan volcano spews ash cloud, residents evacuated
By Ivan Castro
MANAGUA (Reuters) – Nicaragua’s highest volcano belched an ash plume up to 3 miles (5 km) into the atmosphere on Saturday, prompting the evacuation of hundreds of nearby residents.
There were no immediate reports of injuries or damage, authorities said. But the government issued a yellow alert, indicating emergency plans had been activated.
The plume formed a cloud extending 30-miles (48 km) from the 5,725-foot (1,745-meter) San Cristobal volcano, which is about 95 miles (154 km) north of the capital Managua in the country’s volcano-dotted northwest, said the Nicaraguan Institute of Territorial Studies, or Ineter.
Javier Mejia, executive director of Ineter, which monitors seismic and volcanic activity, said he recommended that civil aviation authorities close down the air space near San Cristobal because of the ash plume and cloud, the largest recorded in recent years.
The volcano has long been active, and stirred in mid-2008, when it expelled gas and rumbled with a series of small eruptions. For months it has emitted “abundant gases in a constant manner,” Ineter said in its monthly bulletin.
The government expects to evacuate about 3,000 people from around San Cristobal, though numerous families already have evacuated of their own, said Guillermo Gonzalez, who heads Sinapred, a government emergency and disaster relief agency.
“A response plan exists for volcano eruptions and every community has clearly defined places for people to go to once they are evacuated,” Gonzalez said.
In a preliminary report, Ineter said “more gas emissions and sporadic explosions” could be expected from San Cristobal.
The volcano is one of the most active along Nicaragua’s Pacific coast, according to the institute, and at times averages nearly 100 seismic movements a day.
Government spokeswoman Rosario Murillo earlier said as many as 20,000 people could ultimately be affected.
(Reporting by Ivan Castro; writing by Simon Gardner and Herbert Lash; editing by Will Dunham and Todd Eastham)
| 09.09.2012 | Volcano Eruption | Nicaragua | Chinandega Department, [ San Cristobal volcano] |  |
|
Volcano Eruption in Nicaragua on Saturday, 08 September, 2012 at 18:12 (06:12 PM) UTC.
| Description | |
| Nicaragua’s tallest volcano belched an ash cloud nearly a mile into the atmosphere on Saturday, prompting the evacuation of hundreds of nearby residents who heard explosions emanating from its crater. The 5,725-foot (1,745-meter) San Cristobal volcano, which sits around 95 miles north of the capital Managua in the country’s northwest, has been active in recent years, and stirred in mid-2008, when it expelled gas and rumbled with a series of small eruptions. Government spokeswoman Rosario Murillo said authorities were still assessing the strength of the volcanic activity, and said nearby residents were being evacuated. He said as many as 20,000 people could ultimately be affected by the gas and ash from the volcano. |
| 08.09.2012 02:47 AM | Chiltepe Peninsula Natural Reserve, Nicaragua | Apoyeque Volcano | Volcano Activity | 1404-091 | Pyroclastic shield | 4640 BC +-200é | No. 0 | |
Volcano Activity in Nicaragua on Saturday, 08 September, 2012 at 02:47 (02:47 AM) UTC.
| Description | |
| The Apoyeque Volcano (caldera type volcano), located northwest of the capital, was calm Friday, but officials continued monitoring it for volcanic tremors, a release from the Nicaraguan Institute of Territorial Studies (INETER) said. The agency registered 21 low-intensity volcano-related tremors between Thursday afternoon and Friday morning, prompting the government to issue a green advisory alert. Seismic activity near the volcano, located 10 kilometers northwest of Managua, “decreased Friday morning, but it doesn’t mean that it has disappeared,” INETER Geophysics Director Angélica Munoz told reporters. She also announced that a group of experts will travel to the volcano to investigate the earthquakes causes. The tremors began after a magitude-7.6 earthquake hit neighboring Costa Rica on Wednesday. |
***********************************************************************************************************
Storms / Flooding / Tornadoes
| Active tropical storm system(s) | ||||||||||
| Name of storm system | Location | Formed | Last update | Last category | Course | Wind Speed | Gust | Wave | Source | Details |
| Leslie (AL12) | Atlantic Ocean | 30.08.2012 | 08.09.2012 | Hurricane I | 360 ° | 102 km/h | 120 km/h | 4.27 m | NOAA NHC | |

Tropical Storm data
|
|||||||||||||||||||||||||||||||||||||||||||||||||||||||||||||||||||||||||||||||||||||||||||||||||||||||||||||||||||||||||||||||||||||||||||||||||||||||||||||||||||||||||||||||||||||||||||||||||||||||||||||||||||||
|
|||||||||||||||||||||||||||||||||||||||||||||||||||||||||||||||||||||||||||||||||||||||||||||||||||||||||||||||||||||||||||||||||||||||||||||||||||||||||||||||||||||||||||||||||||||||||||||||||||||||||||||||||||||
| Michael (AL13) | Atlantic Ocean | 04.09.2012 | 08.09.2012 | Hurricane III | 325 ° | 167 km/h | 204 km/h | 4.27 m | NOAA NHC | |

Tropical Storm data
|
||||||||||||||||||||||||||||||||||||||||||||||||||||||||||||||||||||||||||||||||||||||||||||||||||||||||||||||||||||||||||||||||||||||||||||||||||||||||||||||||||
|
||||||||||||||||||||||||||||||||||||||||||||||||||||||||||||||||||||||||||||||||||||||||||||||||||||||||||||||||||||||||||||||||||||||||||||||||||||||||||||||||||
………………………….
4 dead as storms ravage northeast Okla.; Infant among 3 killed when wind destroys motor home
By The Associated Press | Associated Press
NOWATA, Okla. – Authorities say four people — including an infant — have been killed as thunderstorms swept through northeast Oklahoma.
Nowata County Undersheriff Doug Sonenberg tells KSWO-TV (http://www.kswo.com/global/story.asp?s=19489100 ) the infant and two adults were killed Friday when heavy winds destroyed a mobile home. They were found in a creek.
The Oklahoma Highway Patrol also reported that Ash Grove, Mo., resident Jimmy King was killed when straight-line winds flipped the semi he was driving onto a cement barrier wall and trapped him inside near Afton.
Troopers say the 70-year-old King was pinned in the wreckage for nearly three hours and died at the scene of massive injuries.
The storms were part of a system that unleashed winds of 25 mph to 35 mph as it moved through the state.
___
Information from: KSWO-TV, http://www.kswo.com
USGS Helps Assess Tangipahoa Dam Health
JACKSON, Miss. – The U.S. Geological Survey mapped the damage caused to Tangipahoa Dam in 3-D earlier this week, using new technology to get a detailed view of the troubled dam. The dam was damaged during heavy rainfall in Hurricane Isaac and caused thousands of people downstream to be evacuated late last week.
Using terrestrial lidar, or T-lidar, the crew captured multiple scans of the dam, including two large landslides on its downstream side. In the larger of the two slides, much of the base of the slide was still underwater and necessitated the use of a kayak-towed acoustic Doppler profiler to measure the toe of the slide.
The first T-lidar scans took place Saturday, with more completed on Monday to assess whether additional movement of the slides had occurred. Monday’s scan showed little change; information that has been provided along with other data to the U.S. Army Corps of Engineers as they continue to address the issue.
“We were fortunately already mobilizing this fabulous 3-D imaging technology when our field crews learned of the need to monitor the stability of the Tangipahoa Dam,” said USGS Director Marcia McNutt. “I know of no other technology that could compete with T-lidar for providing both the precision and ease of deployment or that has the potential to determine whether a structure is in danger of failing when time is of the essence.”
Isaac is the first storm in which USGS has used its terrestrial lidar capabilities to map urban flooding.
“We brought our T-lidar capabilities into the area affected by Isaac as part of a pilot project to assess its use for mapping flood levels in urban areas, and to develop flood inundation maps that will help forecast future flood effects,” said Toby Minear, a research hydrologist at the USGS California Water Science Center, who completed the scans of the dam. “What we’ve found is that, not only can it help assess current flood levels and high-water marks, it has the potential to play a pivotal role in helping assess the health of structures threatened by floodwaters, providing critical information to those who need it in a matter of minutes.”
T-lidar allows scientists to quickly generate 3-D maps of buildings, dams, levees and other structures, and can show areas of storm damage as well. In a four-to-five minute scan, the instrument collects millions of topographic data points in a full 360-degree view to quickly produce highly accurate topographic information and can map areas up to two-thirds of a mile away.
Acoustic Doppler instruments, such as the one used to map the underwater portion of the slide at Tangipahoa Dam, are frequently used to measure stream or lake geometry and water velocity. An acoustic signal is bounced off the river or lake bottom and the amount of time required for the signal to return to the sensor provides a measurement of the distance to the bottom.
USGS crews also deployed storm surge sensors just below the dam, and at four bridge crossings downstream between the dam and the USGS’ real-time permanent streamgage on the Tangipahoa at Osyka. The sensors allowed the USGS to monitor river levels as actions were taken to release the pressure on the dam and reduce water levels.
| Today | Flash Flood | Philippines | Central Visayas, Cebu City |  |
|
Flash Flood in Philippines on Sunday, 09 September, 2012 at 04:31 (04:31 AM) UTC.
| Description | |
| At least one house was destroyed while another was damaged in Cebu City in the wake of a flash flood brought by heavy rain Saturday, the National Disaster Risk Reduction and Management Council reported Sunday. In a report on its website, the NDRRMC said the incident occurred Saturday afternoon in Sitio Lukana in Kalunasan village in Cebu City. The NDRRMC said the flash flood was due to the overflowing of the Guadalupe River. “One house was totally damaged while another was partially damaged. As of reporting time, no casualty was reported,” it said. It said the Bureau of Fire Protection, the village disaster risk reduction and management council, and the Philippine Red Cross responded to the incident. |
……………………
| 08.09.2012 | Tornado | USA | State of New York, New York City [Breezy Point, Queens] | |
|
Tornado in USA on Saturday, 08 September, 2012 at 16:40 (04:40 PM) UTC.
| Description | |
| Firefighters are assessing damage caused by a cyclone that struck a beachfront neighborhood in New York City. Videos taken by bystanders show a funnel cloud hurling sand and debris in the air as it moved through the Breezy Point section of the Rockaway peninsula in Queens on Saturday. A Fire Department spokesman says there were power lines down and possibly other damage. The general manager of the Breezy Point Surf Club tells The Associated Press the storm ripped up cabanas and even picked up industrial-sized metal trash bins. The National Weather Service issued a tornado warning for Queens and Brooklyn as the storm moved through the city. It expired at 11:30 a.m. The service says radar detected a “strong rotation” in the storm. |
************************************************************************************************************
Radiation / Nuclear
Fukushima I Nuke Plant: Inside the Treated Water Buffer Tank
Published on Sep 7, 2012 by arevamirpal
TEPCO submerged a video camera inside the butter tank that stores the treated water before the water is fed back into the reactors (Units 1, 2, and 3). The amount of water being fed to the reactors for cooling has been fluctuating significantly, and TEPCO hasn’t identified the cause yet.
There are white bits (particles) floating in the water. TEPCO explains the bubbling in the video as “nitrogen”.
For your own copy of the video, go to TEPCO’s Photos and Videos page:
http://photo.tepco.co.jp/en/date/2012/201209-e/120906-01e.html
For more on the problem of the reactor cooling system, read my post: http://bit.ly/PZTFC0
For continued coverage of Fukushima I Nuke Plant accident and radiation contamination in Japan, visit my blogs:
http://www.exskf.com (English)
http://www.exskf-jp.com (Japanese)
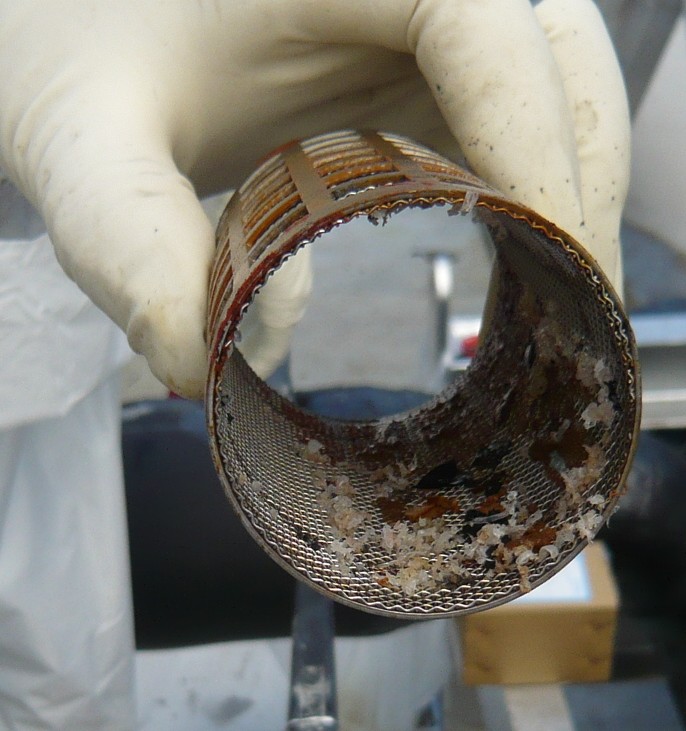
#Fukushima I Nuke Plant: Video Inside the Buffer Tank Shows White Particles Floating in the Treated Water, Rust on the Bottom
TEPCO still hasn’t identified the cause for the decreased water flow into the reactors (1, 2, and 3), but the company suspects some rust or foreign particles clogging the system somewhere. On September 5, a video camera was submerged into one of the buffer tanks that store the treated water before the water is fed back into the reactors.
White particles floating around, like near the bottom of the ocean. I wonder what they are. TEPCO explains the bubbling seen in the video as “nitrogen”.
Here’s a photo of the strainer of one of the 5 “chiller” machines (to cool water), from TEPCO’s 9/5/2012 Photos and Videos page. Rust flakes and curled-up white bits. (It looks like bits of jellyfish…) Click to enlarge.
************************************************************************************************************
Epidemic Hazards / Diseases
Any Foodborne Transmission Among Hantavirus- Swine Flu or WNV?
Not a lot, but some
http://jasn.asnjournals.org/content/16/12/3669.full
************************************************************************************************************
Climate Change
Warmer Temperatures Likely Driving Increase of Metal Concentrations in Rocky Mountain Watershed
Warmer air temperatures since the 1980s may explain significant increases in zinc and other metal concentrations of ecological concern in a Rocky Mountain watershed, according to a new study published in the journal Environmental Science and Technology, led by the U.S. Geological Survey and the University of Colorado, Boulder.
Rising concentrations of zinc and other metals in the upper Snake River just west of the Continental Divide near Keystone, Colo., may be the result of falling water tables, melting permafrost, and accelerating mineral weathering rates, all driven by warmer air temperatures in the watershed. Researchers observed a fourfold increase in dissolved zinc over the last 30 years during the month of September.
“This study provides another fascinating, and troubling, example of a cascading impact from climate warming as the rate of temperature-dependent chemical reactions accelerate in the environment, leaching metals into streams,” said USGS Director Marcia McNutt. “The same concentration of metals in the mountains that drew prospectors to the Rockies more than a century ago are now the source of toxic trace elements that are harming the environment as the planet warms.”
Increases in metals were seen in other months as well, with lesser increases seen during the high-flow snowmelt period. During the study period, local mean annual and mean summer air temperatures increased at a rate of 0.2-1.2 degrees Celsius per decade.
Generally, high concentrations of dissolved metals in the upper Snake River watershed are the result of acid rock drainage, or ARD, formed by natural weathering of pyrite and other metal-rich sulfide minerals in the bedrock. Weathering of pyrite forms sulfuric acid through a series of chemical reactions, and mobilizes metals like zinc from minerals in the rock and carries these metals into streams.
Increased sulfate and calcium concentrations observed over the study period lend weight to the hypothesis that the increased zinc concentrations are due to acceleration of pyrite weathering. The potential for comparable increases in metals in similar Western watersheds is a concern because of impacts on water resources, fisheries and stream ecosystems. Trout populations in the lower Snake River, for example, appear to be limited by the metal concentrations in the water, said USGS scientist Andrew Todd, lead researcher on the project.
“Acid rock drainage is a significant water quality problem facing much of the Western United States,” Todd said. “It is now clear that we need to better understand the relationship between climate and ARD as we consider the management of these watersheds moving forward.”
In cases where ARD is linked directly with past and present mining activities it is called acid mine drainage, or AMD. Another Snake River tributary, Peru Creek, is largely devoid of life due to AMD generated from the abandoned Pennsylvania Mine and smaller mines upstream, and has become a target for potential remediation efforts.
The Colorado Division of Reclamation Mining and Safety, in conjunction with other local, state and federal partners, is conducting underground exploration work at the mine to investigate the sources of heavy metals-laden water draining from the adit. The study conducted by Todd and colleagues has implications in such efforts because it suggests that establishing attainable clean-up objectives could be difficult if natural background metal concentrations are a “moving target.”
Collaborators include USGS, CU Boulder and the Institute of Arctic and Alpine Research (INSTAAR). The data analyzed for the study came from INSTAAR, the USGS and the U.S. Environmental Protection Agency.
************************************************************************************************************
Solar Activity
2MIN News Sept 8. 2012: Earth-Sun Connection- Planetary Positions
Published on Sep 8, 2012 by Suspicious0bservers
STARWATER: http://youtu.be/LiC-92YgZvQ
TODAY’S LINKS
US WInd Map: http://hint.fm/wind/
China Quake Update: http://www.china.org.cn/china/2012-09/08/content_26464807.htm
Rain Records: http://www.cocorahs.org/ViewData/ListIntensePrecipReports.aspx
REPEAT LINKS
Spaceweather: http://spaceweather.com/ [Look on the left at the X-ray Flux and Solar Wind Speed/Density]
HAARP: http://www.haarp.alaska.edu/haarp/data.html [Click online data, and have a little fun]
SDO: http://sdo.gsfc.nasa.gov/data/ [Place to find Solar Images and Videos – as seen from earth]
SOHO: http://sohodata.nascom.nasa.gov/cgi-bin/soho_movie_theater [SOHO; Lasco and EIT – as seen from earth]
Stereo: http://stereo.gsfc.nasa.gov/cgi-bin/images [Stereo; Cor, EUVI, HI – as seen from the side]
SunAEON:http://www.sunaeon.com/#/solarsystem/ [Just click it… trust me]
SOLARIMG: http://solarimg.org/artis/ [All purpose data viewing site]
iSWA: http://iswa.gsfc.nasa.gov/iswa/iSWA.html [Free Application; for advanced sun watchers]
NASA ENLIL SPIRAL: http://iswa.gsfc.nasa.gov:8080/IswaSystemWebApp/iSWACygnetStreamer?timestamp=…
NOAA ENLIL SPIRAL: http://www.swpc.noaa.gov/wsa-enlil/
NOAA Bouys: http://www.ndbc.noaa.gov/
NOAA Environmental Visualization Laboratory: http://www.nnvl.noaa.gov/Default.php
RSOE: http://hisz.rsoe.hu/alertmap/index2.php [That cool alert map I use]
GOES Xray: http://www.swpc.noaa.gov/sxi/goes15/index.html
JAPAN Radiation Map: http://jciv.iidj.net/map/
LISS: http://earthquake.usgs.gov/monitoring/operations/heliplots_gsn.php
Gamma Ray Bursts: http://grb.sonoma.edu/ [Really? You can’t figure out what this one is for?]
BARTOL Cosmic Rays: http://neutronm.bartol.udel.edu//spaceweather/welcome.html [Top left box, look for BIG blue circles]
TORCON: http://www.weather.com/news/tornado-torcon-index [Tornado Forecast for the day]
GOES Weather: http://rsd.gsfc.nasa.gov/goes/ [Clouds over America]
RAIN RECORDS: http://www.cocorahs.org/ViewData/ListIntensePrecipReports.aspx
EL DORADO WORLD WEATHER MAP: http://www.eldoradocountyweather.com/satellite/ssec/world/world-composite-ir-…
PRESSURE MAP: http://www.woweather.com/cgi-bin/expertcharts?LANG=us&MENU=0000000000&…
HURRICANE TRACKER: http://www.weather.com/weather/hurricanecentral/tracker
INTELLICAST: http://www.intellicast.com/ [Weather site used by many youtubers]
NASA News: http://science.nasa.gov/science-news/science-at-nasa/
PHYSORG: http://phys.org/ [GREAT News Site!]
QUAKES LIST FULL: http://www.emsc-csem.org/Earthquake/seismologist.php
************************************************************************************************************
Space
Earth approaching objects (objects that are known in the next 30 days) |
|||||||||
| Object Name | Apporach Date | Left | AU Distance | LD Distance | Estimated Diameter* | Relative Velocity | |||
| (2011 ES4) | 10th September 2012 | 1 day(s) | 0.1792 | 69.8 | 20 m – 44 m | 12.96 km/s | 46656 km/h | ||
| (2008 CO) | 11th September 2012 | 2 day(s) | 0.1847 | 71.9 | 74 m – 160 m | 4.10 km/s | 14760 km/h | ||
| (2007 PB8) | 14th September 2012 | 5 day(s) | 0.1682 | 65.5 | 150 m – 340 m | 14.51 km/s | 52236 km/h | ||
| 226514 (2003 UX34) | 14th September 2012 | 5 day(s) | 0.1882 | 73.2 | 260 m – 590 m | 25.74 km/s | 92664 km/h | ||
| (1998 QC1) | 14th September 2012 | 5 day(s) | 0.1642 | 63.9 | 310 m – 700 m | 17.11 km/s | 61596 km/h | ||
| (2002 EM6) | 15th September 2012 | 6 day(s) | 0.1833 | 71.3 | 270 m – 590 m | 18.56 km/s | 66816 km/h | ||
| (2002 RP137) | 16th September 2012 | 7 day(s) | 0.1624 | 63.2 | 67 m – 150 m | 7.31 km/s | 26316 km/h | ||
| (2009 RX4) | 16th September 2012 | 7 day(s) | 0.1701 | 66.2 | 15 m – 35 m | 8.35 km/s | 30060 km/h | ||
| (2005 UC) | 17th September 2012 | 8 day(s) | 0.1992 | 77.5 | 280 m – 640 m | 7.55 km/s | 27180 km/h | ||
| (2012 FC71) | 18th September 2012 | 9 day(s) | 0.1074 | 41.8 | 24 m – 53 m | 3.51 km/s | 12636 km/h | ||
| (1998 FF14) | 19th September 2012 | 10 day(s) | 0.0928 | 36.1 | 210 m – 480 m | 21.40 km/s | 77040 km/h | ||
| 331990 (2005 FD) | 19th September 2012 | 10 day(s) | 0.1914 | 74.5 | 320 m – 710 m | 15.92 km/s | 57312 km/h | ||
| (2009 SH2) | 24th September 2012 | 15 day(s) | 0.1462 | 56.9 | 28 m – 62 m | 7.52 km/s | 27072 km/h | ||
| 333578 (2006 KM103) | 25th September 2012 | 16 day(s) | 0.0626 | 24.4 | 250 m – 560 m | 8.54 km/s | 30744 km/h | ||
| (2002 EZ2) | 26th September 2012 | 17 day(s) | 0.1922 | 74.8 | 270 m – 610 m | 6.76 km/s | 24336 km/h | ||
| (2009 SB170) | 29th September 2012 | 20 day(s) | 0.1789 | 69.6 | 200 m – 440 m | 32.39 km/s | 116604 km/h | ||
| (2011 OJ45) | 29th September 2012 | 20 day(s) | 0.1339 | 52.1 | 18 m – 39 m | 4.24 km/s | 15264 km/h | ||
| (2012 JS11) | 30th September 2012 | 21 day(s) | 0.0712 | 27.7 | 270 m – 600 m | 12.60 km/s | 45360 km/h | ||
| 137032 (1998 UO1) | 04th October 2012 | 25 day(s) | 0.1545 | 60.1 | 1.3 km – 2.9 km | 32.90 km/s | 118440 km/h | ||
| (2012 GV11) | 05th October 2012 | 26 day(s) | 0.1830 | 71.2 | 100 m – 230 m | 6.96 km/s | 25056 km/h | ||
| (2009 XZ1) | 05th October 2012 | 26 day(s) | 0.1382 | 53.8 | 120 m – 280 m | 16.87 km/s | 60732 km/h | ||
| (2006 TD) | 06th October 2012 | 27 day(s) | 0.1746 | 68.0 | 88 m – 200 m | 13.03 km/s | 46908 km/h | ||
| (2009 TK) | 06th October 2012 | 27 day(s) | 0.0450 | 17.5 | 100 m – 230 m | 11.10 km/s | 39960 km/h | ||
| (2004 UB) | 08th October 2012 | 29 day(s) | 0.1995 | 77.6 | 240 m – 530 m | 14.65 km/s | 52740 km/h | ||
|
|||||||||
*************************************************************************************************************
Biological Hazards / Wildlife
| 09.09.2012 | Biological Hazard | Vietnam | MultiProvinces, [Provinces of Haiphong, Ha Tinh, Ninh Binh, Nam Dinh, Bac Kan, Thanh Hoa and Quang Ngai] | |
|
Biological Hazard in Vietnam on Wednesday, 05 September, 2012 at 13:32 (01:32 PM) UTC.
| Updated: | Sunday, 09 September, 2012 at 03:39 UTC |
| Description | |
| The strain appeared to be a mutation of the H5N1 virus which swept through the countryâs poultry flocks last year, forcing mass culls of birds in affected areas, according to agriculture officials. The new virus âis quickly spreading and this is the big concern of the governmentâ, Deputy Minister of Agriculture and Rural Development Diep Kinh Tan said. Experts cited in the report said the new virus appeared in July and had spread through Vietnamâs northern and central regions in August. Outbreaks have been detected in six provinces so far and some 180,000 birds have been culled, the Animal Health department said. The Central Veterinary Diagnosis Centre said the virus appeared similar to the standard strains of bird flu but was more toxic. The centre will test how much protection existing vaccines for humans offer, the report said. Some experts suggested that the new strain resulted from widespread smuggling of poultry from China into the northern parts of Vietnam. Two people have died this year from the virulent disease â but long before the new strain was identified. According to the World Health Organisation, Vietnam has recorded one of the highest numbers of fatalities from bird flu in southeast Asia, with at least 59 deaths since 2003. The avian influenza virus has killed more than 330 people around the world, and scientists fear it could mutate into a form readily transmissible between humans, with the potential to cause millions of deaths. | |
**************************************************************************************************************
Articles of Interest
| 08.09.2012 | Non-categorized event | China | Province of Chongquing, Chongquing [Yangtze River] | |
|
Non-categorized event in China on Saturday, 08 September, 2012 at 16:43 (04:43 PM) UTC.
| Description | |
| For a river known as the “golden watercourse,” red is a strange color to see. Yet that’s the shade turning up in the Yangtze River and officials have no idea why. The red began appearing in the Yangtze, the longest and largest river in China and the third longest river in the world, yesterday near the city of Chongquing, where the Yangtze connects to the Jialin River. The Yangtze, called “golden” because of the heavy rainfall it receives year-round, runs through Chongqing, Southwest China’s largest industrial and commercial center, also known as the “mountain city” because of the hills and peaks upon which its many buildings and factories stand. The red color stopped some residents in their tracks. They put water from the river in bottles to save it. Fishermen and other workers who rely on the river for income kept going about their business. While the river’s red coloring was most pronounced near Chongqing it was also reported at several other points. Officials are reportedly investigating the cause. |
*************************************************************************************************************
[In accordance with Title 17 U.S.C. Section 107, this material is distributed without profit, for research and/or educational purposes. This constitutes ‘FAIR USE’ of any such copyrighted material.]


